原文地址:https://www.yuque.com/aceld/golang/ga6pb1
一、分析程序的运行时间与CPU利用率情况 🔗
shell内置time指令 🔗
这个方法不算新颖,但是确很实用。 time是Unix/Linux内置多命令,使用时一般不用传过多参数,直接跟上需要调试多程序即可。
time go run main.go
斐波那契数列第30项的值为: 55
real	0m0.843s
user	0m0.216s
sys	0m0.389s
上面是使用time对 go run main.go对执行程序做了性能分析,得到3个指标。
- real:从程序开始到结束,实际度过的时间;
- user:程序在用户态度过的时间;
- sys:程序在系统态度过时间。 一般情况下 real >= user + sys,因为系统还有其它进程(切换其他进程中间对于本进程会有空白期)。
/usr/bin/time指令 🔗
这个指令比内置的time更加详细一些,使用的时候需要用绝对路径,而且要加上参数-v
$ /usr/bin/time -v go run main.go

	Command being timed: "go run main.go"
	User time (seconds): 0.12
	System time (seconds): 0.06
	Percent of CPU this job got: 115%
	Elapsed (wall clock) time (h:mm:ss or m:ss): 0:00.16
	Average shared text size (kbytes): 0
	Average unshared data size (kbytes): 0
	Average stack size (kbytes): 0
	Average total size (kbytes): 0
	Maximum resident set size (kbytes): 41172
	Average resident set size (kbytes): 0
	Major (requiring I/O) page faults: 1
	Minor (reclaiming a frame) page faults: 15880
	Voluntary context switches: 897
	Involuntary context switches: 183
	Swaps: 0
	File system inputs: 256
	File system outputs: 2664
	Socket messages sent: 0
	Socket messages received: 0
	Signals delivered: 0
	Page size (bytes): 4096
	Exit status: 0
二、分析golang程序的内存使用情况 🔗
内存占用情况查看 🔗
我们先写一段demo例子代码
package main

import (
    "log"
    "runtime"
    "time"
)

func test() {
    //slice 会动态扩容,用slice来做堆内存申请
    container := make([]int, 8)

    log.Println(" ===> loop begin.")
    for i := 0; i < 32*1000*1000; i++ {
        container = append(container, i)
    }
    log.Println(" ===> loop end.")
}

func main() {
    log.Println("Start.")

    test()

    log.Println("force gc.")
    runtime.GC() //强制调用gc回收

    log.Println("Done.")

    time.Sleep(3600 * time.Second) //睡眠,保持程序不退出
}
编译
go build -o snippet_mem && ./snippet_mem
然后在./snippet_mem进程没有执行完,再开一个窗口,通过top命令查看进程的内存占用情况
top -p $(pidof snippet_mem)
得到结果如下
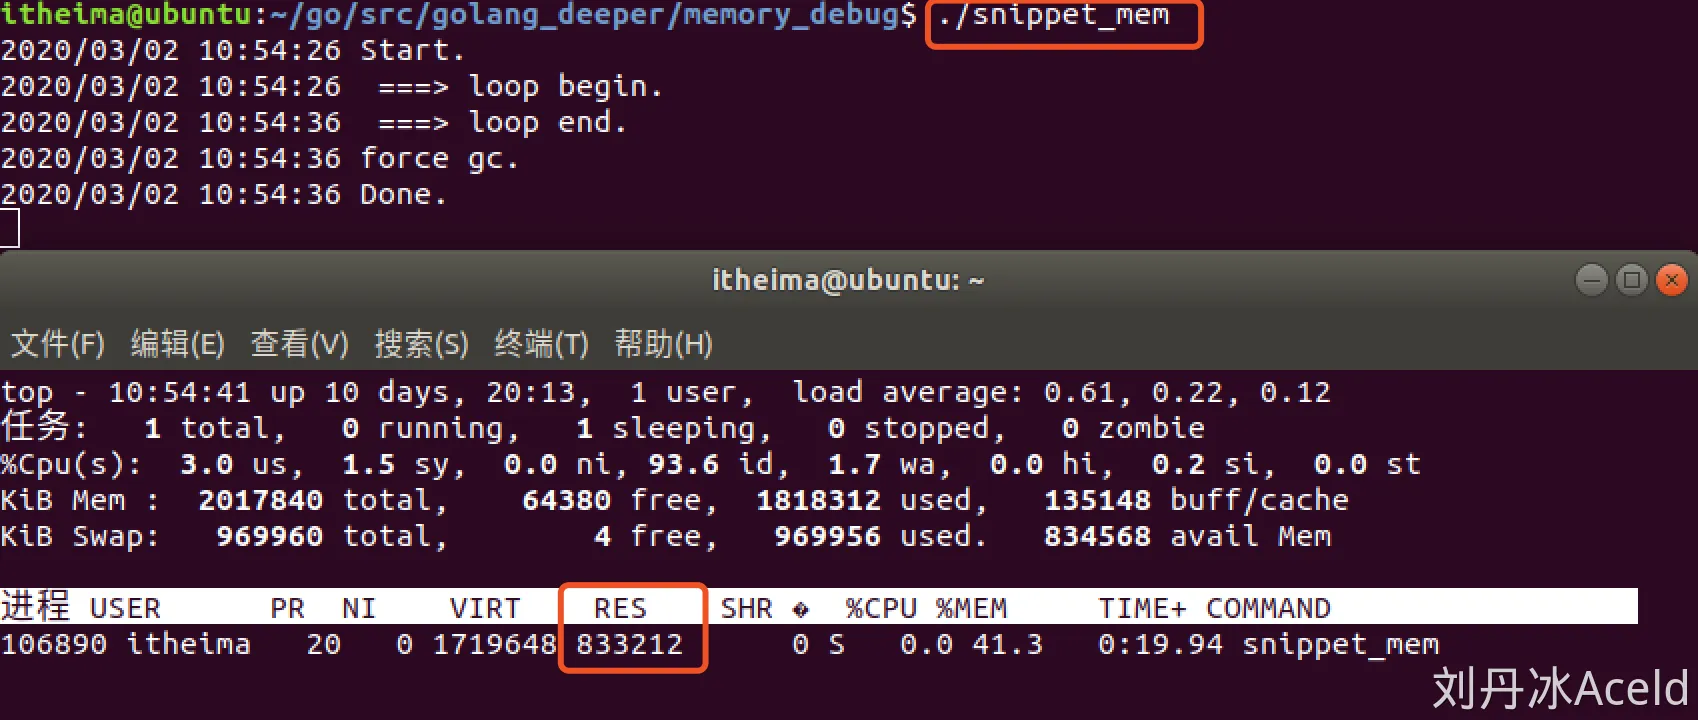 我们看出来,没有退出的snippet_mem进程有约830m的内存被占用。
直观上来说,这个程序在test()函数执行完后,切片contaner的内存应该被释放,不应该占用830M那么大。
使用GODEBUG与gctrace来分析程序的内存使用情况 🔗
执行snippet_mem程序之前添加环境变量GODEBUG=‘gctrace=1’来跟踪打印垃圾回收器信息
GODEBUG='gctrace=1' ./snippet_mem
设置gctrace=1会使得垃圾回收器在每次回收时汇总所回收内存的大小以及耗时, 并将这些内容汇总成单行内容打印到标准错误输出中。 格式
gc # @#s #%: #+#+# ms clock, #+#/#/#+# ms cpu, #->#-># MB, # MB goal, # P
含义
gc #        GC次数的编号,每次GC时递增
@#s         距离程序开始执行时的时间
#%          GC占用的执行时间百分比
#+...+#     GC使用的时间
#->#-># MB  GC开始,结束,以及当前活跃堆内存的大小,单位M
# MB goal   全局堆内存大小
# P         使用processor的数量
例如:
gc 15 @0.123s 4%: 0.051+43+0.003 ms clock, 0.83+0/44/0+0.057 ms cpu, 277->277->94 MB, 277 MB goal, 0 MB stacks, 0 MB globals, 16 P
该条信息含义如下:
gc 15:Gc 调试编号为15@0.123s:此时程序已经执行了0.123s4%::0.123s中其中gc模块占用了4%的时间0.051+43+0.003 ms clock:垃圾回收的时间,分别为STW(stop-the-world)清扫的时间+并发标记和扫描的时间+STW标记的时间0.83+0/44/0+0.057 ms cpu: 垃圾回收占用cpu时间277->277->94 MB: GC开始前堆内存277M, GC结束后堆内存277M,当前活跃的堆内存94M277 MB goal: 全局堆内存大小277M0 MB stacks: 栈内存大小0M0 MB globals: 全局变量内存大小0M16 P: 使用processor的数量16
了解了GC的调试信息读法后,接下来我们来分析一下本次GC的结果。 执行GODEBUG调试
GODEBUG='gctrace=1' ./snippet_mem
输出结果如下:
2024/09/19 21:04:09  ===> loop begin.
gc 1 @0.003s 2%: 0.040+2.0+0.012 ms clock, 0.81+0/2.1/0+0.24 ms cpu, 4->4->1 MB, 4 MB goal, 0 MB stacks, 0 MB globals, 20 P
gc 2 @0.006s 4%: 0.027+8.1+0.14 ms clock, 0.55+0/6.6/0+2.9 ms cpu, 4->5->3 MB, 4 MB goal, 0 MB stacks, 0 MB globals, 20 P
gc 3 @0.015s 4%: 0.026+2.9+0.010 ms clock, 0.52+0/2.9/0+0.21 ms cpu, 7->7->2 MB, 8 MB goal, 0 MB stacks, 0 MB globals, 20 P
gc 4 @0.019s 22%: 0.050+1.1+5.2 ms clock, 1.0+0/1.1/0+105 ms cpu, 6->10->7 MB, 6 MB goal, 0 MB stacks, 0 MB globals, 20 P
gc 5 @0.026s 17%: 0.028+10+0.014 ms clock, 0.56+0/10/0+0.29 ms cpu, 19->19->6 MB, 19 MB goal, 0 MB stacks, 0 MB globals, 20 P
gc 6 @0.037s 12%: 0.031+14+0.067 ms clock, 0.63+0/4.5/0.001+1.3 ms cpu, 14->24->18 MB, 14 MB goal, 0 MB stacks, 0 MB globals, 20 P
gc 7 @0.067s 8%: 0.037+44+0.21 ms clock, 0.75+0/44/0+4.2 ms cpu, 46->46->28 MB, 46 MB goal, 0 MB stacks, 0 MB globals, 20 P
gc 8 @0.116s 7%: 0.035+25+0.028 ms clock, 0.71+0/24/0+0.57 ms cpu, 72->72->44 MB, 72 MB goal, 0 MB stacks, 0 MB globals, 20 P
gc 9 @0.150s 6%: 0.036+53+0.059 ms clock, 0.72+0/53/0+1.1 ms cpu, 113->113->38 MB, 113 MB goal, 0 MB stacks, 0 MB globals, 20 P
gc 10 @0.204s 6%: 0.079+9.0+0.011 ms clock, 1.5+0/8.9/0+0.23 ms cpu, 86->86->48 MB, 86 MB goal, 0 MB stacks, 0 MB globals, 20 P
gc 11 @0.213s 6%: 0.10+19+0.23 ms clock, 2.1+0/19/0+4.6 ms cpu, 108->108->108 MB, 108 MB goal, 0 MB stacks, 0 MB globals, 20 P
gc 12 @0.283s 5%: 0.025+40+0.024 ms clock, 0.50+0/40/0+0.48 ms cpu, 277->277->169 MB, 277 MB goal, 0 MB stacks, 0 MB globals, 20 P
gc 13 @0.408s 4%: 0.035+101+0.006 ms clock, 0.70+0/101/0+0.12 ms cpu, 433->433->147 MB, 433 MB goal, 0 MB stacks, 0 MB globals, 20 P
gc 14 @0.510s 4%: 0.011+18+0.005 ms clock, 0.22+0/18/0+0.10 ms cpu, 330->330->183 MB, 330 MB goal, 0 MB stacks, 0 MB globals, 20 P
gc 15 @0.529s 4%: 0.010+36+0.011 ms clock, 0.20+0/36/0+0.22 ms cpu, 413->413->229 MB, 413 MB goal, 0 MB stacks, 0 MB globals, 20 P
2024/09/19 21:04:10  ===> loop end.
2024/09/19 21:04:10 force gc.
gc 16 @0.566s 4%: 0.022+116+0.004 ms clock, 0.45+0/116/0+0.094 ms cpu, 516->516->0 MB, 516 MB goal, 0 MB stacks, 0 MB globals, 20 P
gc 17 @0.682s 4%: 0.080+0.17+0.073 ms clock, 1.6+0/0.15/0+1.4 ms cpu, 0->0->0 MB, 4 MB goal, 0 MB stacks, 0 MB globals, 20 P (forced)
2024/09/19 21:04:10 Done.
GC forced
gc 18 @121.392s 0%: 0.029+0.29+0.004 ms clock, 0.59+0/0.31/0+0.093 ms cpu, 0->0->0 MB, 4 MB goal, 0 MB stacks, 0 MB globals, 20 P
分析
先看在test()函数执行完后立即打印的gc 16那行的信息。516->516->0 MB, 516 MB goal表示垃圾回收器已经把516M的内存标记为非活跃的内存。
再看下一个记录gc 17行0->0->0 MB, 4 MB goal表示垃圾回收器中的全局堆内存大小由888M下降为4M。
结论
- 在test()函数执行完后,demo程序中的切片容器所申请的堆空间都被垃圾回收器回收了。
- 如果此时在top指令查询内存的时候,如果依然是800+MB,说明垃圾回收器回收了应用层的内存后,
(可能)并不会立即将内存归还给系统。
runtime.ReadMemStats 🔗
接下来换另一种方式查看内存的方式 利用 runtime库里的ReadMemStats()方法
package main

import (
    "log"
    "runtime"
    "time"
)

func readMemStats() {

    var ms runtime.MemStats

    runtime.ReadMemStats(&ms)

    log.Printf(" ===> Alloc:%d(bytes) HeapIdle:%d(bytes) HeapReleased:%d(bytes)", ms.Alloc, ms.HeapIdle, ms.HeapReleased)
}

func test() {
    //slice 会动态扩容,用slice来做堆内存申请
    container := make([]int, 8)

    log.Println(" ===> loop begin.")
    for i := 0; i < 32*1000*1000; i++ {
        container = append(container, i)
        if ( i == 16*1000*1000) {
            readMemStats()
        }
    }

    log.Println(" ===> loop end.")
}

func main() {
    log.Println(" ===> [Start].")

    readMemStats()
    test()
    readMemStats()

    log.Println(" ===> [force gc].")
    runtime.GC() //强制调用gc回收

    log.Println(" ===> [Done].")
    readMemStats()

    go func() {
        for {
            readMemStats()
            time.Sleep(10 * time.Second)
        }
    }()

    time.Sleep(3600 * time.Second) //睡眠,保持程序不退出
}
这里我们, 封装了一个函数readMemStats(),这里面主要是调用runtime中的ReadMemStats()方法获得内存信息,然后通过log打印出来。
go run main.go
2020/03/02 18:21:17  ===> [Start].
2020/03/02 18:21:17  ===> Alloc:71280(bytes) HeapIdle:66633728(bytes) HeapReleased:66600960(bytes)
2020/03/02 18:21:17  ===> loop begin.
2020/03/02 18:21:18  ===> Alloc:132535744(bytes) HeapIdle:336756736(bytes) HeapReleased:155721728(bytes)
2020/03/02 18:21:38  ===> loop end.
2020/03/02 18:21:38  ===> Alloc:598300600(bytes) HeapIdle:609181696(bytes) HeapReleased:434323456(bytes)
2020/03/02 18:21:38  ===> [force gc].
2020/03/02 18:21:38  ===> [Done].
2020/03/02 18:21:38  ===> Alloc:55840(bytes) HeapIdle:1207427072(bytes) HeapReleased:434266112(bytes)
2020/03/02 18:21:38  ===> Alloc:56656(bytes) HeapIdle:1207394304(bytes) HeapReleased:434266112(bytes)
2020/03/02 18:21:48  ===> Alloc:56912(bytes) HeapIdle:1207394304(bytes) HeapReleased:1206493184(bytes)
2020/03/02 18:21:58  ===> Alloc:57488(bytes) HeapIdle:1207394304(bytes) HeapReleased:1206493184(bytes)
2020/03/02 18:22:08  ===> Alloc:57616(bytes) HeapIdle:1207394304(bytes) HeapReleased:1206493184(bytes)
c2020/03/02 18:22:18  ===> Alloc:57744(bytes) HeapIdle:1207394304(bytes) HeapReleased:1206493184(by
说明:
- Alloc:已分配但尚未释放的内存字节数,包括堆内存和栈内存等
- HeapIdle:当前未使用但仍然保留给堆的内存字节数(即可以快速重新使用的内存)
- HeapReleased:已归还给操作系统(但未来可能再次申请)的堆内存字节数
可以看到,打印[Done].之后那条trace信息,Alloc已经下降,即内存已被垃圾回收器回收。在2025/09/19 21:17:31和2020/03/02 18:21:48的两条trace信息中,HeapReleased开始上升,即垃圾回收器把内存归还给系统。
更多MemStats说明:https://pkg.go.dev/runtime#MemStats
pprof工具 🔗
pprof工具支持网页上查看内存的使用情况,需要在代码中添加一个协程即可。
完整示例代码:
package main

import (
    "log"
    "runtime"
    "time"
    "net/http"
    _ "net/http/pprof"
)

func readMemStats() {

    var ms runtime.MemStats

    runtime.ReadMemStats(&ms)

    log.Printf(" ===> Alloc:%d(bytes) HeapIdle:%d(bytes) HeapReleased:%d(bytes)", ms.Alloc, ms.HeapIdle, ms.HeapReleased)
}

func test() {
    //slice 会动态扩容,用slice来做堆内存申请
    container := make([]int, 8)

    log.Println(" ===> loop begin.")
    for i := 0; i < 32*1000*1000; i++ {
        container = append(container, i)
        if ( i == 16*1000*1000) {
            readMemStats()
        }
    }

    log.Println(" ===> loop end.")
}

func main() {


    //启动pprof
    go func() {
        log.Println(http.ListenAndServe("0.0.0.0:10000", nil))
    }()

    log.Println(" ===> [Start].")

    readMemStats()
    test()
    readMemStats()

    log.Println(" ===> [force gc].")
    runtime.GC() //强制调用gc回收

    log.Println(" ===> [Done].")
    readMemStats()

    go func() {
        for {
            readMemStats()
            time.Sleep(10 * time.Second)
        }
    }()

    time.Sleep(3600 * time.Second) //睡眠,保持程序不退出
}
访问:http://127.0.0.1:10000/debug/pprof/heap?debug=1 查看
浏览器的内容其中有一部分如下,记录了目前的内存情况
# runtime.MemStats
# Alloc = 393328
# TotalAlloc = 1503610448
# Sys = 991758840
# Lookups = 0
# Mallocs = 1023
# Frees = 233
# HeapAlloc = 393328
# HeapSys = 985137152
# HeapIdle = 984096768
# HeapInuse = 1040384
# HeapReleased = 984006656
# HeapObjects = 790
# Stack = 524288 / 524288
# MSpan = 75680 / 81600
# MCache = 24000 / 31200
# BuckHashSys = 1450271
# GCSys = 3206184
# OtherSys = 1328145
# NextGC = 4194304
# LastGC = 1758288816398705240
三、分析Golang程序的CPU性能情况 🔗
CPU性能测试代码 🔗
package main

import (
    "bytes"
    "math/rand"
    "time"
    "log"
    "net/http"
    _ "net/http/pprof"
)


func test() {

    log.Println(" ===> loop begin.")
    for i := 0; i < 1000; i++ {
        log.Println(genSomeBytes())
    }

    log.Println(" ===> loop end.")
}

//生成一个随机字符串
func genSomeBytes() *bytes.Buffer {

    var buff bytes.Buffer

    for i := 1; i < 20000; i++ {
        buff.Write([]byte{'0' + byte(rand.Intn(10))})
    }

    return &buff
}

func main() {

    go func() {
        for {
            test()
            time.Sleep(time.Second * 1)
        }
    }()

    //启动pprof
    http.ListenAndServe("0.0.0.0:10000", nil)

}
使用pprof-Web界面查看 🔗
浏览器访问: http://127.0.0.1:10000/debug/pprof/
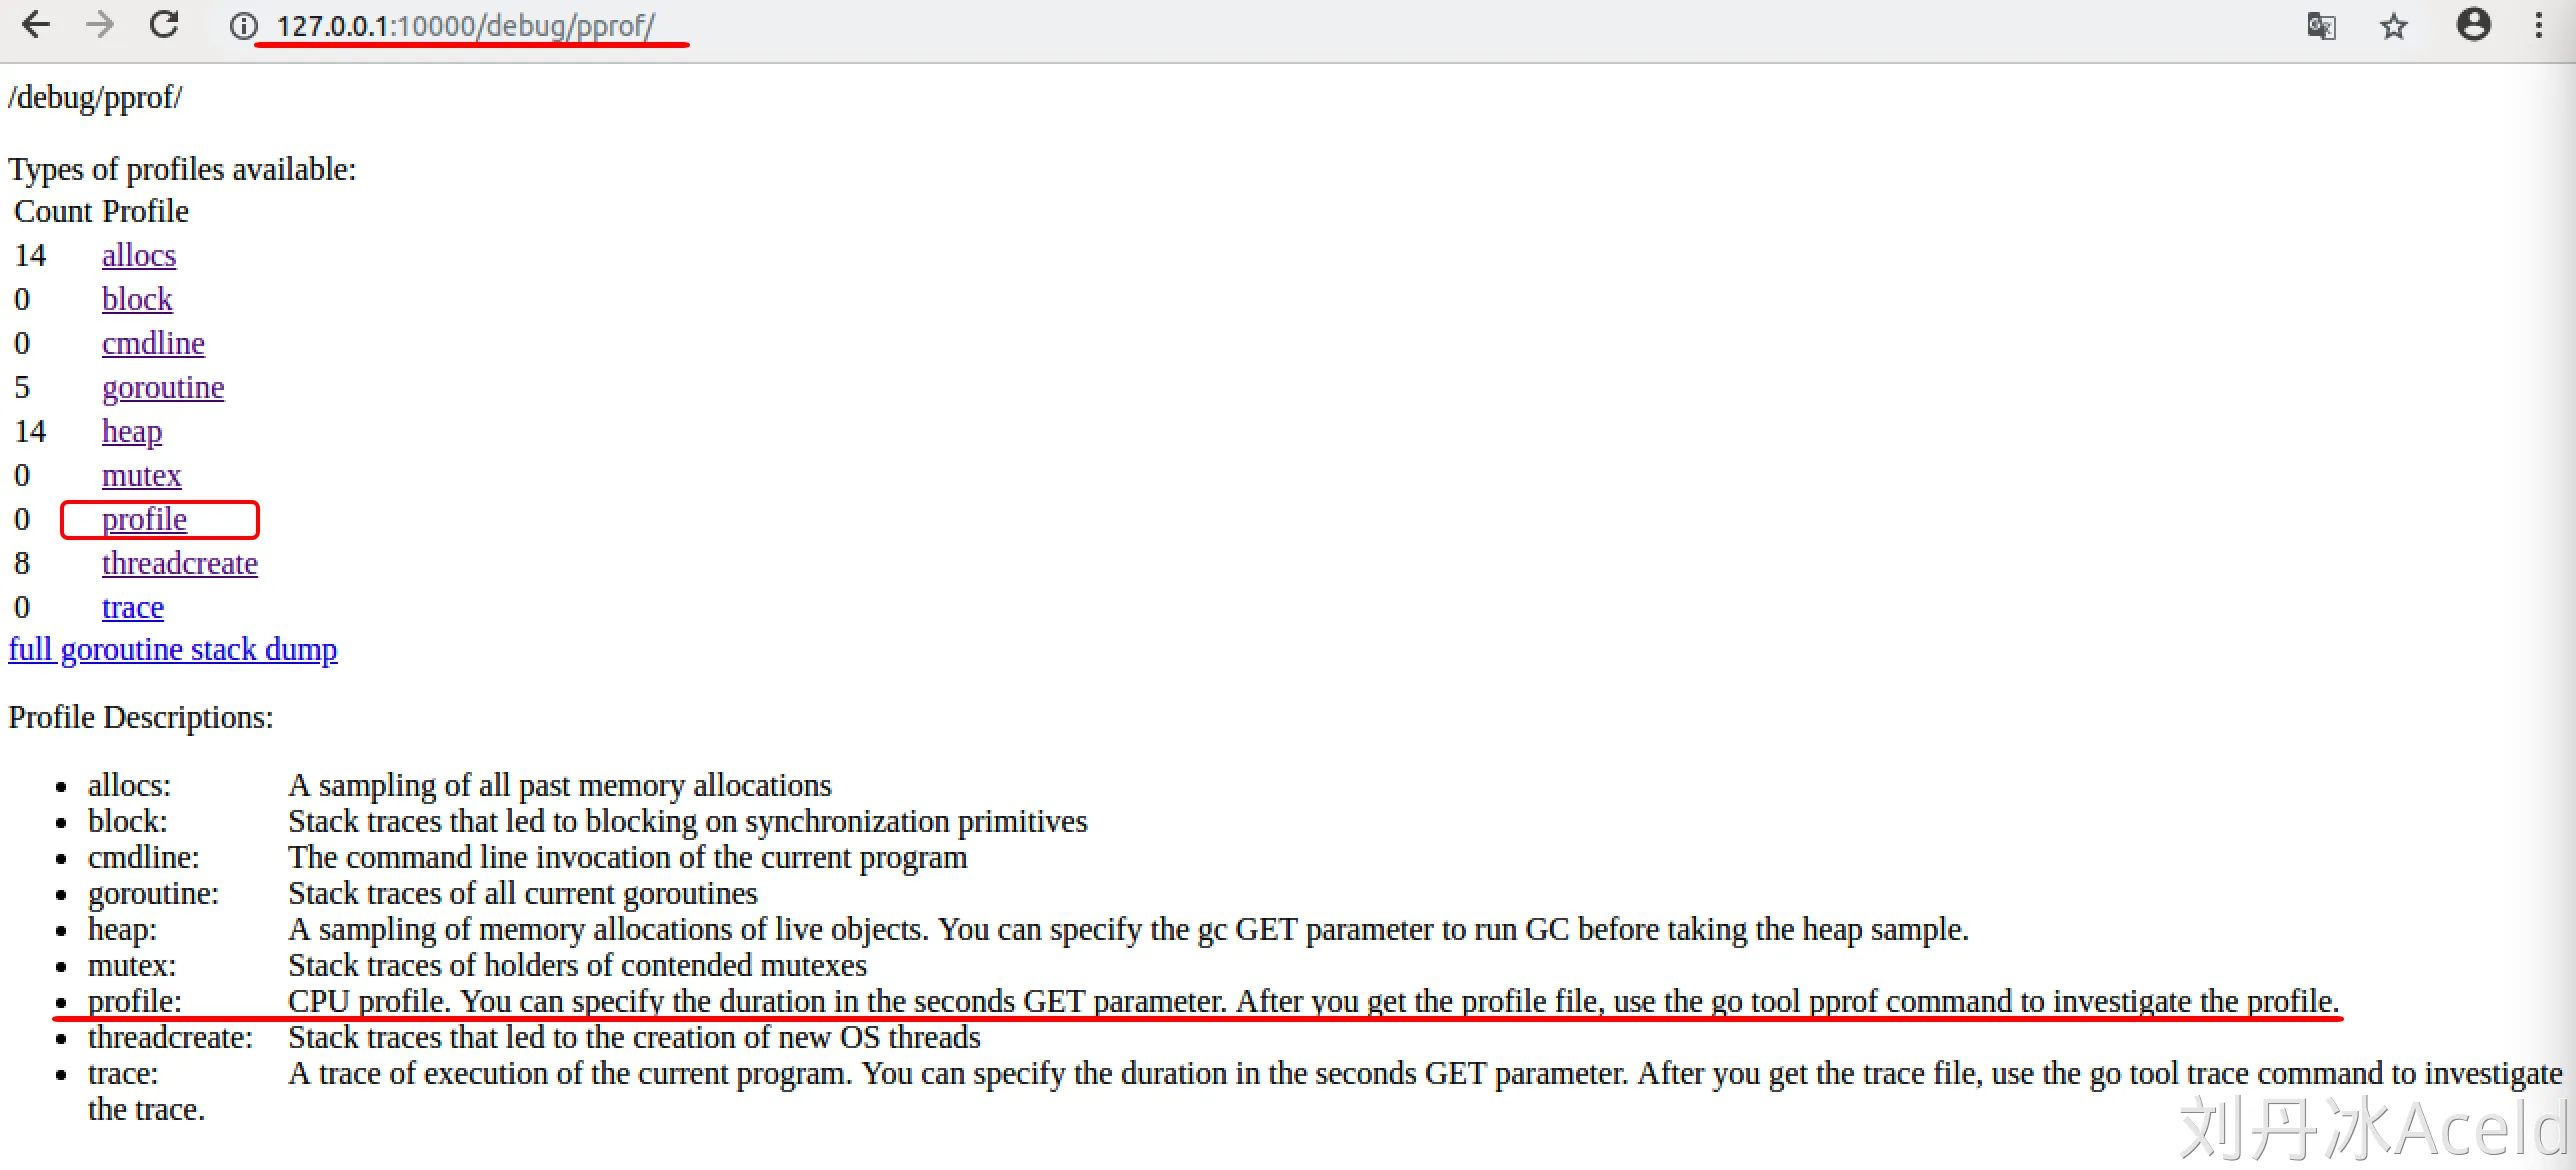 我们可以直接点击网页的profile,浏览器会给我们下载一个profile文件.
使用pprof工具查看 🔗
将下载的profile文件和go的二进制文件一起放在同一个目录下,然后执行如下命令
go tool pprof [binary] [profile]
- binary:go可执行的二进制文件
- profile:web界面下载的profile文件
go tool pprof ./democpu profile
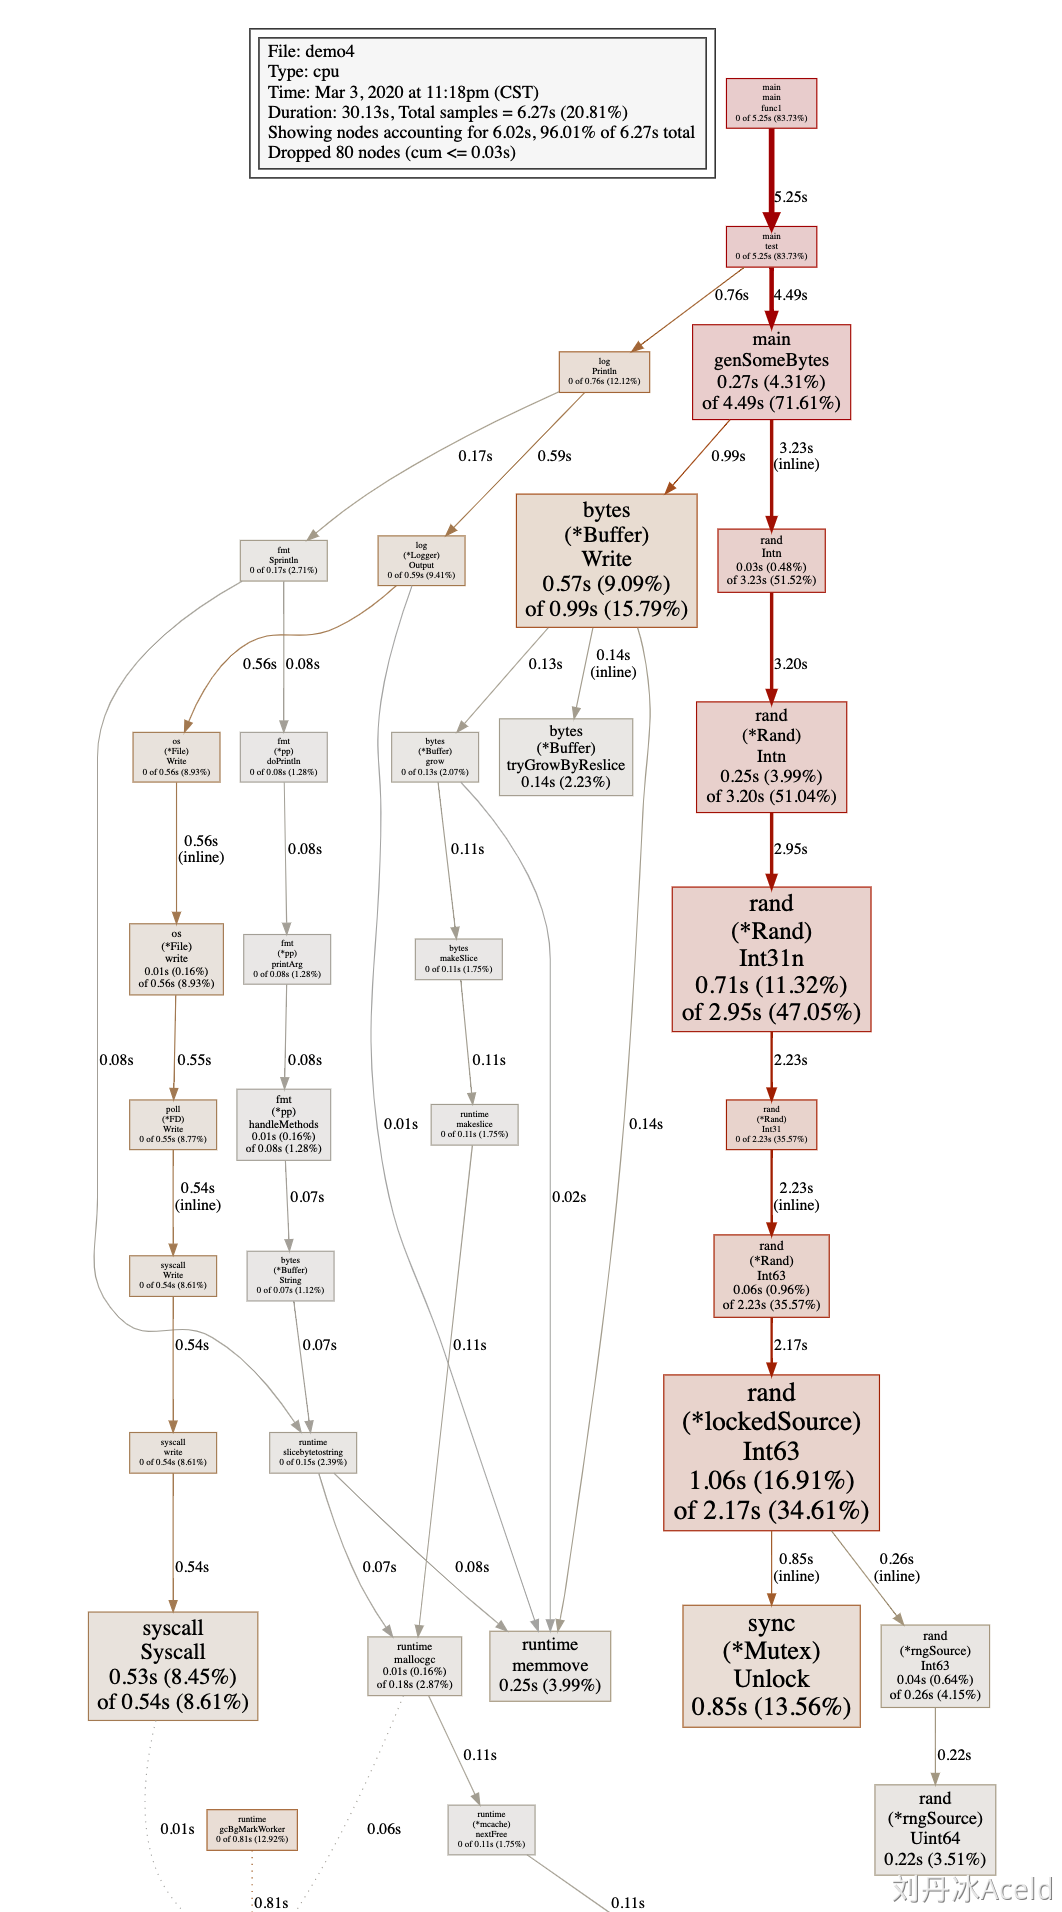
File: democpu
Type: cpu
Time: Mar 3, 2020 at 11:18pm (CST)
Duration: 30.13s, Total samples = 6.27s (20.81%)
Entering interactive mode (type "help" for commands, "o" for options)
(pprof)
help可以查看一些指令,我么可以通过top来查看cpu的性能情况.
(pprof) top
Showing nodes accounting for 5090ms, 81.18% of 6270ms total
Dropped 80 nodes (cum <= 31.35ms)
Showing top 10 nodes out of 60
      flat  flat%   sum%        cum   cum%
    1060ms 16.91% 16.91%     2170ms 34.61%  math/rand.(*lockedSource).Int63
     850ms 13.56% 30.46%      850ms 13.56%  sync.(*Mutex).Unlock (inline)
     710ms 11.32% 41.79%     2950ms 47.05%  math/rand.(*Rand).Int31n
     570ms  9.09% 50.88%      990ms 15.79%  bytes.(*Buffer).Write
     530ms  8.45% 59.33%      540ms  8.61%  syscall.Syscall
     370ms  5.90% 65.23%      370ms  5.90%  runtime.procyield
     270ms  4.31% 69.54%     4490ms 71.61%  main.genSomeBytes
     250ms  3.99% 73.52%     3200ms 51.04%  math/rand.(*Rand).Intn
     250ms  3.99% 77.51%      250ms  3.99%  runtime.memmove
     230ms  3.67% 81.18%      690ms 11.00%  runtime.suspendG
(pprof)
这里面有几列数据,需要说明一下.
- flat:当前函数占用CPU的耗时
- flat%::当前函数占用CPU的耗时百分比
- sum%:函数占用CPU的耗时累计百分比
- cum:当前函数加上调用当前函数的函数占用CPU的总耗时
- cum%:当前函数加上调用当前函数的函数占用CPU的总耗时百分比
- 最后一列:函数名称
通过go tool pprof得到profile文件 🔗
web下载的默认是30s,通过下面命令可以得到60s的profile文件
go tool pprof http://localhost:10000/debug/pprof/profile?seconds=60
 go tool pprof http://localhost:10000/debug/pprof/profile?seconds=60
Fetching profile over HTTP from http://localhost:10000/debug/pprof/profile?seconds=60
Saved profile in /home/abner/pprof/pprof.procpu.samples.cpu.001.pb.gz
File: procpu
Type: cpu
Time: Sep 19, 2024 at 10:28pm (CST)
Duration: 60.16s, Total samples = 18.90s (31.42%)
Entering interactive mode (type "help" for commands, "o" for options)
(pprof) top
Showing nodes accounting for 14990ms, 79.31% of 18900ms total
Dropped 191 nodes (cum <= 94.50ms)
Showing top 10 nodes out of 74
      flat  flat%   sum%        cum   cum%
    3650ms 19.31% 19.31%     8440ms 44.66%  math/rand.(*Rand).Int31n
    2960ms 15.66% 34.97%     2960ms 15.66%  internal/runtime/syscall.Syscall6
    2770ms 14.66% 49.63%     2770ms 14.66%  internal/chacha8rand.block
    1190ms  6.30% 55.93%     3050ms 16.14%  bytes.(*Buffer).Write
    1160ms  6.14% 62.06%     1160ms  6.14%  runtime.memmove
     780ms  4.13% 66.19%    14010ms 74.13%  main.genSomeBytes
     780ms  4.13% 70.32%     3970ms 21.01%  runtime.rand
     660ms  3.49% 73.81%     9100ms 48.15%  math/rand.(*Rand).Intn
     550ms  2.91% 76.72%    10130ms 53.60%  math/rand.Intn
     490ms  2.59% 79.31%     4790ms 25.34%  math/rand.(*Rand).Int63 (inline)
(pprof)
可视化查看 🔗
输入web
go tool pprof ./democpu profile

File: democpu
Type: cpu
Time: Mar 3, 2020 at 11:18pm (CST)
Duration: 30.13s, Total samples = 6.27s (20.81%)
Entering interactive mode (type "help" for commands, "o" for options)
(pprof) web
这里如果报找不到graphviz工具,需要安装一下 Ubuntu安装:
sudo apt-get install graphviz
Mac安装:
brew install graphviz
Win安装: 下载https://graphviz.gitlab.io/_pages/Download/Download_windows.html 将graphviz安装目录下的bin文件夹添加到Path环境变量中。 在终端输入dot -version查看是否安装成功。